Using Churn to Estimate SAST Accuracy
Conor Mancone and Tom Nijboer, Cimpress Security and Privacy
Abstract
We present churn: a metric to estimate the accuracy of static application security testing (SAST) tools. We define churn as the fraction of SAST issues (compared to the total number of issues) which are opened or closed due to changes in the underlying SAST algorithm rather than due to changes in the code itself. We discuss how churn and accuracy are inversely correlated - e.g., if churn is high then accuracy must be low. Using a sample of ~25,000 issues identified from ~1,500 repositories over a one year time period, we measure churn for our SAST, finding that ~83% of issues are opened or closed due to changes in the SAST algorithm. This implies that the accuracy of our SAST tool for our codebase is at most 17%.
As a check, we manually measure the false positive rate (defined as the fraction of detected issues which are not real vulnerabilities) for a representative subset of issues (~300 total). We measure a false positive rate of 80% ± 10%. Ignoring the false negative rate (which we cannot measure), this implies an accuracy of 20 ± 10%, in excellent agreement with the upper limit set by our churn measurements. Given that churn can be easily measured for issues in bulk (as opposed to manually evaluating issues to directly measure the false positive rate), we encourage SAST vendors to measure and track it as part of their release validation strategy and also suggest that development teams use it to ensure that they are getting the expected value out of their tooling.
1. Introduction
The SAST market continues to grow, but maintaining this in the long-run will not be possible without consistency in a key area: accuracy. Naturally, all the major SAST vendors advertise themselves as having high accuracy. There’s an important caveat to this though: accuracy is not a monolithic property of a SAST system. The fact that SAST operates directly on code gives it an unavoidable dependency on coding style that doesn’t exist for other security tools. As such, the question is not “how accurate is a given SAST tool”? Rather, it is “how accurate is a given SAST tool for a particular code base?”.
It’s worthwhile to dive into the details of why there is a connection between coding style and SAST accuracy. Overall, this dependency shouldn’t be too surprising: after all, SAST vendors all publish lists of supported application frameworks. A given SAST scanner will clearly have more trouble identifying issues when scanning code built with an unsupported framework. This is the most direct example of how specific coding decisions impact SAST accuracy, but the connection doesn’t stop there.
At its core, SAST works by following the flow of data through an application to identify places where information flows from untrusted data sources (incoming HTTP requests, responses from HTTP calls, etc) to unsafe data sinks (SQL queries, HTML, etc) without flowing through an appropriate sanitizer/filter. From this perspective, the proper identification of sources, filters, and sinks becomes a prerequisite for high accuracy, with misidentification resulting in false positives or false negatives. For example, if a SAST tool doesn’t properly understand the application framework in use then it won’t be able to identify where data flows into the application, and false negatives are inevitable. On the other hand, it may mistake some innocuous section of code as an entry point for an application, and thus create false positives.
Similar classification mistakes for filters and data sinks result in false positives and false negatives, and there are many reasons why the likelihood of a SAST scanner to misclassify such things depends on the code itself. For instance, sanitizers that are built into a language are likely to be recognized - e.g., using a built-in function to convert input to an integer before using it in a sensitive function - but it’s harder to recognize a guard that rejects non-integer input, and even harder to automatically recognize when input is checked against a strict list of allowed values. Thus, a SAST scanner may have different levels of accuracy from one codebase to another depending on the patterns commonly used by a team (e.g. use of built-ins functions for validation vs use of bespoke validators).
Third party libraries are also an important source of variation in SAST accuracy. Here, it’s important to understand that SAST engines don’t scan third party code. Rather, they rely on a-priori knowledge of the security implications of third party libraries. This means that accuracy can vary depending on whether or not a codebase uses third party libraries that are understood by some given SAST tool and whether or not they use those libraries in the expected ways.
The end result of all of this is that a vendor may promise high accuracy - and even have the data to back that claim up - and yet may operate poorly when used with code that is substantially different than its training set. For smaller companies with smaller codebases, it may be immediately obvious when this happens. However, it can be a challenge for larger companies adopting new tooling who suddenly find themselves with thousands (or tens of thousands!) of new issues. It’s rarely practical to evaluate such a large number of issues in bulk to understand if a given SAST tool is working well in practice, since doing so would require manually evaluating a large fraction of those issues. Thus, even after a tool has been adopted, it can be a challenge to understand if it is actually working as desired. Companies and teams can therefore get stuck: accuracy information from the SAST vendor may not apply to the findings for their own codebase, and yet validating the accuracy of a tool against their own codebase is rarely possible. This forces teams to rely on self-attestations from the vendor or overall impressions from the development teams. The lack of hard data makes it difficult for a team to determine with certainty if they are getting the expected value out of their tooling.
2. Churn
2.1 Background
It’s natural for the issues detected by a scanner to change over time as the scanner itself is updated. We refer to this change in issues caused by changes in the scanner as issue churn. Indeed, issue churn is unavoidable because scanner updates are unavoidable - a given SAST tool must keep up with changes in the language, changes in third party libraries, reports of false positives/negatives from users, and any other updates that may be pushed out to improve results and performance. Therefore, some issue churn is not just expected but necessary, and a sign of healthy SAST maintenance.
However, excessive churn is a problem both for its own sake and because of the implications for accuracy. It’s a problem on its own because issues created by a SAST tool as a result of scanner updates are implicitly created outside of the normal development cycle for the engineering team that owns the code. This requires engineers to come back and evaluate the issues as they have time, rather than when they are actively writing the code - defeating one of the benefits of SAST.
The connection between accuracy and churn is also fairly simple. If an update to a SAST engine results in a new issue being opened, then that issue was either a false negative before or it is a false positive now. Similarly, if a change to a SAST engine results in closing an issue (e.g. the engine no longer thinks an issue is valid) then either the issue was a false positive before or it is a false negative now. Therefore, as long as changes in the SAST algorithm are a dominant factor in the opening or closing of issues (e.g. the churn is high) then the accuracy must be low. Note however that the inverse is not necessarily true: low churn does not imply high accuracy, since an inherently inaccurate algorithm can have low churn as long as it does not change substantially between releases. Therefore, we expect that churn can be used to set an upper limit on the accuracy of a SAST engine, with the added advantage that it can be measured for issues in bulk without having to manually evaluate issues one-by-one (the usual process for determining accuracy).
2.2 Dataset and Methodology
We therefore measured churn for our SAST provider against our code base. For this analysis we use all of the code repositories for two of our businesses (Vista and Cimpress Technology). Combined, they have over 10,000 repositories that represent a wide variety of languages, frameworks, and techniques. Our SAST provider scanned repositories for both businesses in bulk and we examined the results from roughly a one year time period. Over this time period, our SAST engine identified a total of 34,549 issues in 1,447 separate repositories. However, not all of these issues can be used in our churn calculations. We exclude any issues that were introduced when the repository was first scanned - after all, in such cases, we have no “history” for the issue and so no way to understand if it was caused by a code change or a change in the SAST engine. This brings the sample down to 24,955 issues (10,134 still open, 14,821 resolved) which can be reliably categorized as churn/not churn.
In order to categorize an issue as churn, we need to understand whether it was opened or closed as part of a code change or because of a change in the SAST engine. This process is complicated by the fact that our SAST is not self-hosted - rather, it is provided as Software-as-a-Service, which means that we don’t have direct visibility into when a new version is released. Since we have no visibility into the release cycle, we rely on the commit history of our repositories to identify churn. We compare the creation/closure time for issues with the commit history of the repository it came from. If there is a commit in the repository on the same day that the issue was opened/closed (note: scans are automatically triggered by code changes), then we assume that the change in the issue was caused by a code change, and the issue is therefore not churn. In general we actually expect this to lead to an underestimate of churn, since a broad one-day matching window will lead to overmatching between issue changes and code changes. Still, we’d rather over-match (and underestimate churn) than the opposite, so we stick with our 24-hour matching window.
2.3 Results
Of the 10,134 issues in our sample that are still open, 8054 (79%) of them were opened due to changes in our SAST algorithm. Of the 14,821 resolved issues in our sample, 12,738 (86%) were closed due to changes in the SAST algorithm. Averaging these together we measure a churn rate of 83%. Clearly, changes to the issues in our sample are predominantly caused by changes in the underlying SAST algorithm and not by changes in the code. We take a simple approach to convert from churn to accuracy and assume that the churn sets an upper limit on the accuracy via this simple relationship (where both churn and accuracy are expressed as percentages):
Accuracy < 100% - Churn
Given our measured churn rate of 83%, this implies an accuracy of <17%.
As an additional check to verify that issue changes are dominated by changes to our SAST engine, we plot in Figure 1 the total number of newly created issues per day for our entire data set (the black line). We also plot the number of commits made per day for any repository that has SAST issues (the blue line). Finally, the green and red vertical lines denote days when our SAST provider announced changes to the engine via their changelog.
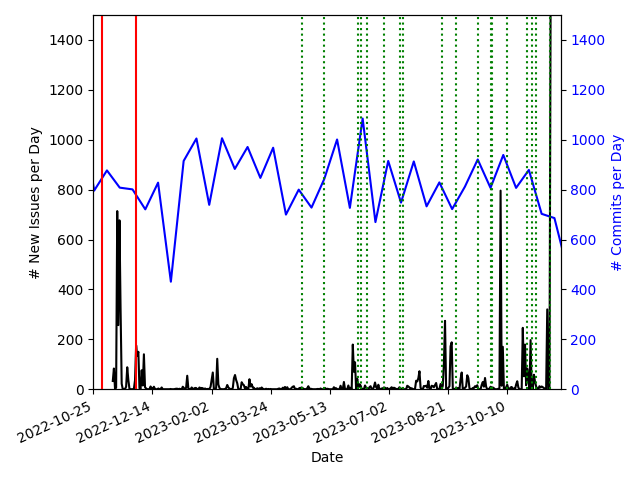
The goal here is to provide a sanity check to confirm that changes in the SAST engine are indeed the dominant factor in changes to our issues. It is worth noting that the changelog is not very precise: updates in the change log often mention changes that will roll out in a phased manner over the subsequent week, or mention changes that rolled out previously. So, while our plot denotes the specific date when a change was announced on the changelog, the actual roll out process itself is rarely so precise.
The first thing we note is that the rate of commits in our repositories is effectively constant, averaging roughly 800 commits per day across the entire time range of our study. However, the rate at which issues are introduced is not. There is a relatively constant baseline of newly introduced issues, similar to the constant rate of commits created in our repositories. However, this “background” of new issues is dwarfed by large spikes in issue creation. The fact that commits are constant but issue creation happens sporadically already suggests that the two are not correlated with each other. To demonstrate this statistically we apply the two-sample Kolmogorov–Smirnov (KS) test to compare the cumulative distribution function (CDF) for commits made in our repositories with that of issue creation. The KS test gives a zero percent probability that issue creation and commits are part of the same underlying distribution. In essence, there is no correlation between code changes and changes to issues, which runs contrary to expectations for a SAST system that is looking directly at code.
On the other hand, the spikes in issue creation do correlate well with the announced changes from our SAST provider. We don’t bother with a KS test because the number of announced changes is very low and they don’t correspond perfectly with the actual date when the engine was updated. However, many of the spikes can be easily correlated with announced releases. For instance, a large change was announced in November of 2022 (no specific date was given), and we see a large spike in issue creation in the middle of November. No changes were announced from mid December 2022 through May of 2023, and while we do see some small spikes in issue creation (likely the result of unannounced changes), it’s also a quiet time for our dataset. We saw a modest spike in created issues (~200 new issues) in early June 2023, and then a few days later (June 6th) our SAST provider announced a change that had already rolled out earlier that week. Additional spikes in mid-August correlate well with announced changes.
The clearest example that demonstrates how our SAST provider is dominating our issues - and that this is a symptom of low accuracy - is at the very end of our sample. In early October our SAST provider announced a major overhaul for the PHP language, and we saw a large spike of almost ~800 PHP issues created just a few days later. Our provider discovered some issues with this deployment and ended up rolling it back. When this happened, all the newly created issues were closed. On November 15th, they announced that they were rolling out their PHP changes again, and the next day we saw the largest spike in issue creation in our sample with ~1500 issues created at once. These issues were created almost exclusively for two copies of WordPress stored in our SCM, with each copy of WordPress getting hundreds of identical issues created. Some digging revealed that almost all of these issues were caused by a misunderstanding of the data flow in WordPress and, hence, they were false positives. Overall, we find these facts to be in excellent agreement with our claims about churn:
- Identifying opened/closed issues that don’t have corresponding changes in the code base allows us to trace issue churn. The frequency of such issues tells us about the stability and accuracy of the underlying algorithm itself.
- High churn and high accuracy are mutually exclusive.
2.4 Changes Over Time
In the above analysis we determine that the churn rate for our SAST provider is high. However, it’s important to ask if it is improving with time. It could be argued that a high churn implies that the SAST provider is working quickly to improve their platform. In that case, it could be a good sign for the long-term future of the platform. We therefore ask: can we see evidence for an improvement in churn?
We investigate this by measuring churn for each month. We calculate the total number of issues opened during the month and then calculate the percentage of those that were opened due to a change in the SAST algorithm, rather than a change in the underlying code base. We once again ignore issues that were opened when the repository was first scanned by our SAST, since these cannot be associated with either changes in the code base or changes in SAST. The results are plotted below in Figure 2.
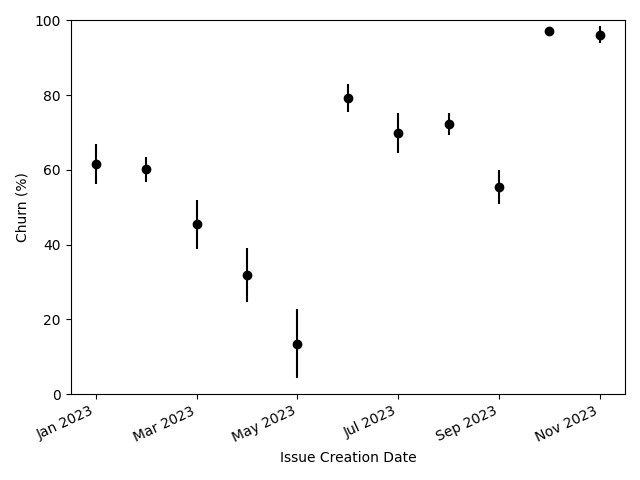
Churn is lower from March through May, a time period when our provider was pushing out less frequent updates, so the low churn is likely a reflection of a slower release cadence, and not necessarily an indication of improvement. The churn rate is nearly 100% in October and November. This, of course, is due to the large number of spurious issues caused by the rollout of the PHP overhaul. Overall, there appears to be an apparent increase in churn over time.
3. Measuring the False Positive Rate
3.1 Background
We’ve discussed how high churn implies low accuracy, measured the churn for a large number of issues, and identified some concrete examples of where high churn was a sign of low accuracy (specifically, a high false positive rate). Still, a more direct measurement of accuracy for our code base would help to verify the connection with churn, especially since our churn measurement implies such a low accuracy. We can’t measure the false negative rate for our SAST scanner against our code base (since, with real world code, we don’t have a list of all vulnerabilities). Fortunately, we can measure the false positive rate by manually evaluating the issues raised by our SAST tool. Of course, practical limitations mean that we can only evaluate a small subset of issues, but this still gives us a sanity check on the accuracy implied by our churn measurements.
3.2 Dataset
To start our manual evaluation we selected the repositories for three of our internal teams (our application security team, cloud engineering team, and access management team). These repositories primarily use Python and JavaScript in conjunction with a variety of frameworks and “kinds” of workloads: backend API endpoints, front-end applications, backend processing tasks, and more.
Overall, there are roughly 400 repositories for these teams. Of these, our SAST identified issues in 66 repositories finding a total of 407 issues, 157 of which were still open at the time of our investigation. For closed issues we matched the closure date given against the commit history of the repository in order to find the commit that closed the issue. Of the 250 closed issues, 148 had a matching commit, giving us a total sample of 305 issues which we could evaluate for true/false positives (157 open issues and 148 closed issues with a matching commit).
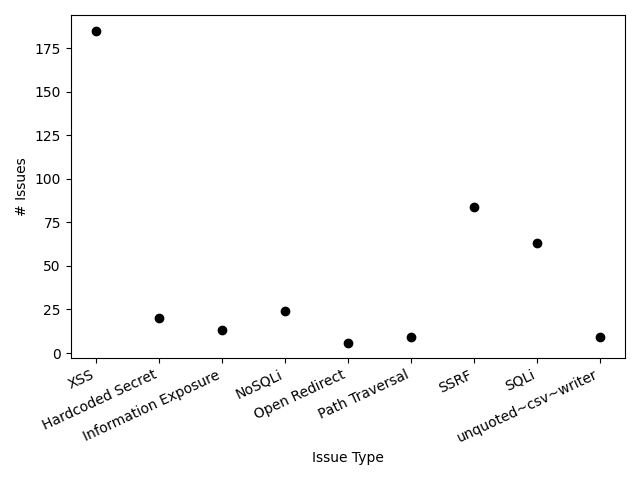
The following plot shows the types of issues identified for those issue types with more than five total issues found in the three teams we studied. Cross Site Scripting (XSS) dominates the identified issues, with substantial contributions from Server Side Request Forgery (SSRF) and SQL Injection (SQLi).
3.3 Results
We then manually evaluated these 305 issues to determine if they were true or false positives. We define a true positive as a case where an issue has been raised and a vulnerability exists. A false positive is defined as a case where the flow of data through the code has been misunderstood, and an issue is raised despite there being no vulnerability. We found a total of 30 true positives and 275 false positives. We define accuracy as the percentage of true findings relative to all issues (in essence, ignoring the unmeasurable false negative rate), and so find that our SAST scanner has an accuracy of 10%.
In the following figure, we show the same classes of issues as Figure 3, but now show the number of true positives for each issue type:
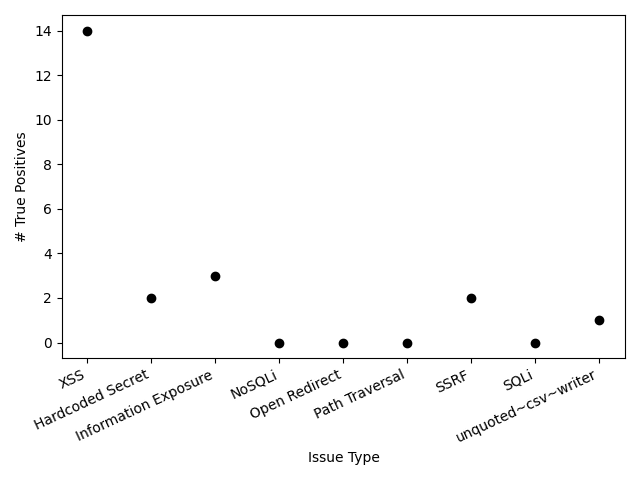
Note that true positives were found in some additional categories not included in Figure 3. This includes, for instance, three CSRF vulnerabilities caused by a misconfiguration in a Java/Spring application. We do not have any remote code execution (RCE) issues identified by our SAST. This is likely a reflection of the fact that the repositories we studied simply do not make use of commands that can cause RCE issues in the first place (e.g. eval, os.system, etc).
There are cases where an issue may be a false positive, but not due to any fault on the part of the SAST tool. This happens when the code itself looks vulnerable, hence a SAST tool would create a finding, but mitigations which are invisible to a SAST tool exist and make the issue a false positive. Such mitigations might include situations where the detected vulnerability is actually the intended behavior of the application, cases where the deployment environment makes it a non-issue, the presence of ad-hoc validation steps that exist in the code but which even a perfect SAST tool can’t be expected to understand, and other such situations. We did attempt to distinguish such cases in our investigation but found that they are rare and their detection is somewhat ambiguous. We found 28 cases where a finding was not a true positive, but where the SAST engine may not have had sufficient context to understand that fact. Thus, these cases represented at most 10% of all false positives. If we exclude these issues altogether our measured accuracy would rise from 10% to 20%.
In this analysis we included all issues that had been identified by our SAST in all three organizations. This included some issues that are currently closed. The inclusion of these issues does have an impact on our measured accuracy, as the closed issues tended to skew a little more heavily towards false positives. This influences the accuracy calculation by roughly 10 percentage points. Thus, our accuracy measurement clearly has some sources of systematic error, since it depends on exactly which issues we include in the calculation (e.g. only open vs all issues and whether or not to include issues that even a perfect SAST scanner might get wrong). We roll these facts together and assign a final measured accuracy of 20% ± 10%.
4. Summary and Conclusions
We measure the churn rate and accuracy of our SAST provider, finding a churn rate (defined as the percentage of issues created/remediated by changes in the SAST engine relative to all issues) of 83% for a sample of ~20,000 issues. We measure an accuracy (the percentage of true issues to all issues) of 20% ± 10% for our sample of 305 manually evaluated issues. Viewing the churn as an upper limit on the accuracy (e.g. 83% churn implies the accuracy is <17%), we find that these two independent measures are in good agreement with each other.
An accuracy of ~20% is likely much lower than what companies would expect from a SAST provider. While this could be a sign of vendors over-promising and under-delivering, more prosaic reasons could explain the difference. As discussed above, the accuracy of SAST is tied closely to coding style and dependency choice. As a result, the low quality of our results could be a sign that our coding practices tend to differ strongly from the training set used by our SAST provider. Further work would be required to determine exactly why the accuracy we find for our SAST tool is so low.
Regardless of why the accuracy is low, this highlights the advantages of churn. It’s a simple metric that can be calculated for issues at scale. This means that companies using a SAST tool can measure churn for their own code base and potentially discover any accuracy issues that would negatively impact their results.
In addition, a high churn is itself a problem worth raising with a provider. After all, it means that an engineering team may work hard to address all the issues in a repository, only to have additional issues opened with the next SAST update. It also creates challenges for centralized teams tracking progress, as the general expectation is that the change in issues reflects engineering effort: e.g. decreasing issues means that teams are fixing problems, and increasing issues means that teams are creating security issues. This is clearly not the case so long as the SAST engine itself is an important factor in opening or closing issues.
Finally, while churn can be a useful metric for teams to understand the quality of results they are getting from their tooling, it can also be helpful for SAST providers themselves. It can be used as an additional check during the release validation process. In practice, this would mean collating a large set of public repositories for churn analysis with each new proposed release. Changes in issues would then give insight into possible accuracy challenges for the scanner, and a release could potentially be rejected if it generates an unexpectedly large churn. Churn can also be tracked in the long-term to verify that incremental changes in the algorithm haven’t resulted in an almost complete turnover of the results, which is what we observe in our analysis here.